2018年5月19日雅思写作机经重点预测四
参考题目4
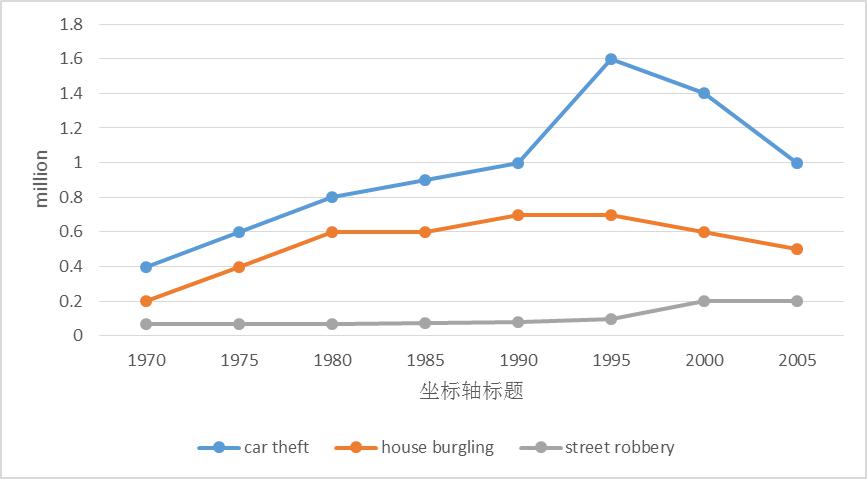
The line graph shows three different crimes in England and Wales in 1970-2005.
图片

解题思路
【首段】总述图表显示1970年到2005年英格兰和威尔士三种类型的犯罪数量 【二段】分述汽车偷盗在此期间的变化 【三段】分述入室盗窃和街头抢劫在此期间的变化 【尾段】总述在英格兰和威尔士汽车盗窃和入室盗窃是最多的犯罪种类,街头抢劫则是最少的犯罪种类
范文
The line graph compares the number of three different kinds of crimes in England and Wales during the period from 1970 to 2005. In 1970,the number of car theft was the highest (0.4 million), which was twice the figure for house burgling and nearly eight times the figure for street robbery. Then it increased quickly and reached one million in the year 1990, after which it soared to 1.6 million in 1995. However, in the rest years, the crime rate of car theft declined dramatically to the 1990 figure. As to the number of house burgling, it experienced a similar trend with the figure for car theft in the first 10-year period, while the number fluctuated and then dropped slowly to 0.5 million in 2005. When it comes to the number of street robbery, it remained stable until 1990. Afterwards, there was a slight increase of 0.8 million in the following years. All in all, car theft and house burgling are the main crimes in England and Wales, while the figure of street robbery was the lowest.
- 03-27·2019年4月6日雅思写作小范围机经预测
- 03-25·2019年4月27日雅思写作机经预测
- 03-20·2019年4月25日雅思写作机经题目预测及范文
- 03-19·2019年4月13日雅思写作机经预测
- 03-18·2019年4月6日雅思写作小范围预测
- 12019-02-262019年3月9日雅思写作小范围预测
- 22019-02-122019年2月16日雅思写作机经预测
- 32019-01-262019年1月26日雅思写作小范围预测
- 42019-01-172019年1月19日雅思写作大范围预测
- 52019-01-172019年1月19日雅思写作小范围预测
编辑推荐
- 模拟试题
- 历年真题


